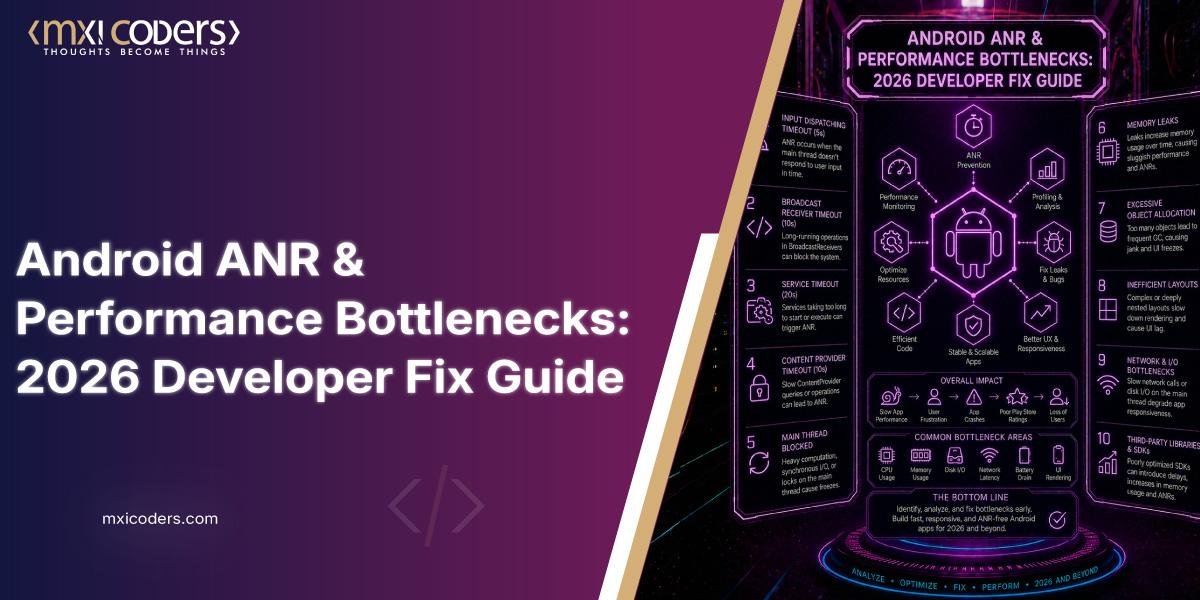
If your Android app freezes, lags, or drains battery, it’s almost always one of a handful of root causes: a blocked main thread, an unstable UI layer, a memory leak, or chatty network calls. Each one has a specific fix, and each one now carries a real cost on Google Play, since Android vitals tracks all of them and can quietly reduce your app’s visibility.
Android app speed isn’t just a technical nice-to-have anymore. Google Play enforces a bad behavior threshold of at least 0.47% of daily active users experiencing a user-perceived ANR across all devices, with a stricter 8% threshold if a single device model is affected, and apps that cross either line become less discoverable in the Play Store. On top of that, Google added battery drain to the list of things it penalizes: starting March 1, 2026, apps whose non-exempt wake locks run 2 or more cumulative hours in a 24-hour period, affecting more than 5% of sessions over a rolling 28-day window, can be excluded from recommendation surfaces and shown a battery-drain warning on their store listing, per Android’s excessive partial wake lock policy. That’s a meaningfully bigger surface area than “just fix your crashes.”
Session abandonment backs this up from the user side too. Research cited by Marketing Dive found that 53% of mobile users abandon a session that takes more than three seconds to load. Retention data tells a similar story: AppsFlyer’s benchmarks, reported through Business of Apps, put average Android Day 1 retention at 20.2%, dropping to just 3.8% by Day 30. Performance is a big part of why that curve is so steep.
➤ Why does my Android app show ANR errors?
An Application Not Responding dialog fires when the main thread is blocked for more than five seconds by work that should have been offloaded, things like database writes, JSON parsing, or heavy calculations. On a 120Hz display, users notice stutter well before that five-second cliff, since even a 200-millisecond hitch is visible. The fix is to move network and database work onto Kotlin Coroutines with Dispatchers.IO, and to enable StrictMode in debug builds so main-thread violations get caught before they ship.
➤ Why is Jetpack Compose making my app slower?
Compose can skip recomposing a composable entirely if its parameters haven’t changed, but only if the compiler can prove those parameters are stable. Mutable lists, plain data classes with var fields, and types from modules without the Compose compiler are all treated as unstable by default, according to Android’s own stability documentation, which forces Compose to recompose them on every parent update whether or not anything actually changed. Marking model classes @Stable or @Immutable, or switching to Kotlinx immutable collections, gives the compiler what it needs to skip unnecessary work.
➤ Why does my app take so long to start?
Cold start delay usually comes from initializing too many SDKs (analytics, ads, marketing tools) inside Application.onCreate() before the first frame can render. Lazy-loading those SDKs helps, but the bigger lever is Baseline Profiles, which Google’s documentation says improve code execution speed by about 30% from first launch by letting ART ahead-of-time compile the app’s critical code paths instead of relying on slower just-in-time compilation. Real teams see a range around that figure: the Android Calendar team measured roughly a 17% drop in median startup latency alongside a 42 to 60% cut in janky frames after adding Baseline Profiles, according to Android Developers’ own case study, while Trello reported a 25% startup improvement and Meta’s teams saw gains up to 40% across their apps.
➤ What causes memory leaks in Android apps?
A leak happens when something, often a static view, a singleton listener, or a long-running background thread, keeps a reference to a destroyed Activity or Context, so the garbage collector can never reclaim that memory. It’s a slow bleed rather than a sudden failure: memory usage climbs, garbage collection runs more often and eats more CPU, and eventually the app throws an OutOfMemoryError. Square’s own documentation for LeakCanary notes that after their engineers started using it in the Square Point of Sale app, they reduced their OOM crash rate by 94%, which is a fairly striking illustration of how much of a device’s instability can trace back to leaks nobody was watching for.
➤ Why does image loading eat up memory?
Loading a full-resolution photo into a small thumbnail view wastes memory for no visual benefit and raises crash risk on lower-end devices. Using Coil or Glide for automatic downsampling, and converting source images to WebP, cuts both memory footprint and decode time without a visible quality loss.
➤ Why do deeply nested layouts slow down my app?
Every extra level in a view hierarchy adds measurement and layout passes the system has to run on each frame. Legacy XML screens tend to over-nest LinearLayouts, and Compose screens can do the equivalent with unnecessary Column and Row wrapping. Flattening the hierarchy with ConstraintLayout in XML, or relying on LazyColumn in Compose instead of manually nested containers, removes that overhead directly.
➤ Why does my app drain battery in the background?
This is the bottleneck most teams still underrate, and it’s the one Google just started actively penalizing. A wake lock keeps the CPU running even with the screen off, and if a background service or job forgets to release it, the device never gets to sleep. As of the 2026 policy, Google Play now tracks this at the session level and can down-rank an app’s discoverability for it, separately from crash and ANR rates. Replacing raw Service and manual wake lock calls with WorkManager, and letting the system handle Doze Mode, is the standard fix.
➤ Why do too many network calls slow my app?
Fetching a single screen’s data through five separate API calls, or pulling a bloated JSON payload when only three fields are needed, adds latency that has nothing to do with device performance. Using GraphQL to request only what’s needed, paired with offline-first caching through Room and a stale-while-revalidate pattern, cuts both the number of round trips and the amount of data moved per trip.
➤ Why is my APK too big, and does that actually matter?
A larger download hurts before a user ever opens the app: Google’s own research found that every 6MB increase in served APK size costs about a 1% drop in install conversion. Publishing through Android App Bundles instead of a universal APK lets Google Play serve only the code and resources a given device actually needs, which brings an average size reduction of around 15%. Enabling R8 shrinking on top of that trims further by removing unused code paths entirely.
➤ How do I know if my app is dropping frames?
Most teams track crashes closely and ignore jank, but dropped frames are just as visible to users as a crash, they just don’t show up in a crash dashboard. The JankStats Jetpack library measures frame timing directly, and Google Play Console Vitals surfaces a “Slow Rendering” metric so teams can catch regressions before users start uninstalling over it.
➤ A quick comparison
| Bottleneck | Mechanism | Best Fix | Trade-off |
| Main-thread blocking (ANR) | UI thread blocked over 5 seconds by I/O or heavy computation | Kotlin Coroutines with Dispatchers.IO, StrictMode in debug | Coroutines still need correct scoping, or you trade ANRs for silent leaks |
| Unstable Compose recomposition | Compiler can’t prove parameters are unchanged, so it always recomposes | @Stable / @Immutable annotations, persistent collections | Mislabeling a genuinely mutable class as stable hides real bugs |
| Cold start delay | Too many SDKs initialize before first frame; no AOT compilation | Lazy-load SDKs, add Baseline Profiles | Gains vary widely (15 to 40%) by app and device tier |
| Memory leaks | Destroyed Activity or Context still referenced somewhere | LeakCanary in debug, lifecycle-aware components | Only catches leaks actually exercised during testing |
| Chatty network calls | Multiple or over-fetching API calls per screen | GraphQL, offline-first caching with Room | Added caching layer increases complexity and staleness risk |
➤ Why this matters beyond engineering
None of this stays confined to a bug tracker. ANR rate, crash rate, and now wake lock behavior all feed into whether Google Play actively shows or hides your app to new users, which means performance work has a direct line to install growth, not just to user satisfaction after the fact.
➤ Limitations, Caveats, and Industry Challenges
Performance gains from Baseline Profiles vary meaningfully by app architecture and device tier, the 15 to 40% range cited above reflects different teams measuring different user journeys, not a guaranteed outcome for any given app. Google Play’s specific thresholds and enforcement dates for ANR, crash, and wake lock metrics are also revised periodically (the ANR and wake lock documentation referenced here was last updated in May and June 2026 respectively), so teams should confirm current numbers against Android’s live documentation before treating any figure as fixed. I’ll also flag directly that I don’t have a verified, specific client project or benchmark number from Mxicoders to cite here, and I’d rather leave that gap open than invent one; if there’s a real anonymized case (a specific ANR-rate reduction, a startup-time improvement on a shipped app) it belongs here as the strongest trust signal on the page.
➤ Frequently asked questions
- What ANR rate will actually get my app penalized on Google Play?
Two separate thresholds apply. Your app is flagged if at least 0.47% of daily active users hit a user-perceived ANR across all devices combined, or if a single device model alone sees an 8% ANR rate among its users, even if your overall number looks fine. - Can a memory leak cause an ANR, not just a crash?
Yes. As leaked objects pile up, garbage collection runs more frequently and consumes more CPU time, which is exactly the kind of main-thread pressure that can push a slow operation past the five-second ANR threshold well before you ever see an OutOfMemoryError. - Do Baseline Profiles help every app by the same amount?
No. Google’s general figure is around 30%, but real teams see a spread: the Android Calendar team measured about 17% faster median startup, Trello reported 25%, and some of Meta’s apps saw up to 40% depending on which user journeys were profiled. - Will switching to an Android App Bundle actually make my app feel faster?
Not directly. App Bundles reduce download size, which improves install conversion and reduces low-storage uninstalls, but they don’t touch runtime performance issues like ANRs or jank. Those need separate fixes. - What’s the new battery rule Google Play added in 2026?
Starting March 1, 2026, Google Play tracks non-exempt partial wake locks at the session level. If an app holds 2 or more cumulative hours of wake locks in a single 24-hour period, and that pattern affects more than 5% of sessions over a rolling 28-day window, the app can lose visibility in Play Store recommendations and show a battery-drain warning on its listing.
➤ Conclusion
Android performance work has quietly become a ranking factor as much as a technical one. Google Play now watches ANRs, crashes, and battery behavior at the session level, and each of the ten bottlenecks above maps to a specific, well-documented fix rather than a vague “optimize your code” directive. Teams that treat Baseline Profiles, stable Compose parameters, and disciplined wake lock use as standard practice, not just crash-fighting, are the ones whose apps stay discoverable as Google keeps tightening these thresholds.
➤ Ready to fix these bottlenecks in your own app?
If your team is dealing with rising ANR rates, sluggish cold starts, or a Play Console warning you don’t fully understand, it helps to have Android engineers who live in this layer of the stack day to day. Mxicoders works with product teams on exactly this kind of Android application development, from diagnosing a specific vitals regression to rebuilding a startup path around Baseline Profiles. If you’re evaluating where Android is heading next, our team also breaks down where Android app development is trending over the next few years, and for teams weighing a broader rebuild, our custom mobile app development services page covers how we scope that kind of work.
Book a free consultation if you’d like a second set of eyes on your app’s current Android vitals.
➤ Sources Used
- ANRs | App quality | Android Developers (updated May 19, 2026)
- Excessive partial wake locks | App quality | Android Developers (updated June 10, 2026)
- Optimize your app battery using Android vitals wake lock metric | Android Developers Blog
- Stability in Compose | Jetpack Compose | Android Developers (updated January 16, 2026)
- Baseline Profiles overview | Android Developers
- How the Android Calendar team improved app startup and jank with Baseline Profiles | Android Developers
- LeakCanary Fundamentals | Square
- Reduce your app size | App quality | Android Developers
- App Retention Rates (2026) | Business of Apps (AppsFlyer data)
- 53% of mobile users abandon sites over 3 seconds | Marketing Dive